Adding Media Attachment
Media can be attached to text input, canned responses and VAS question types. Media can only be attached to existing questions.
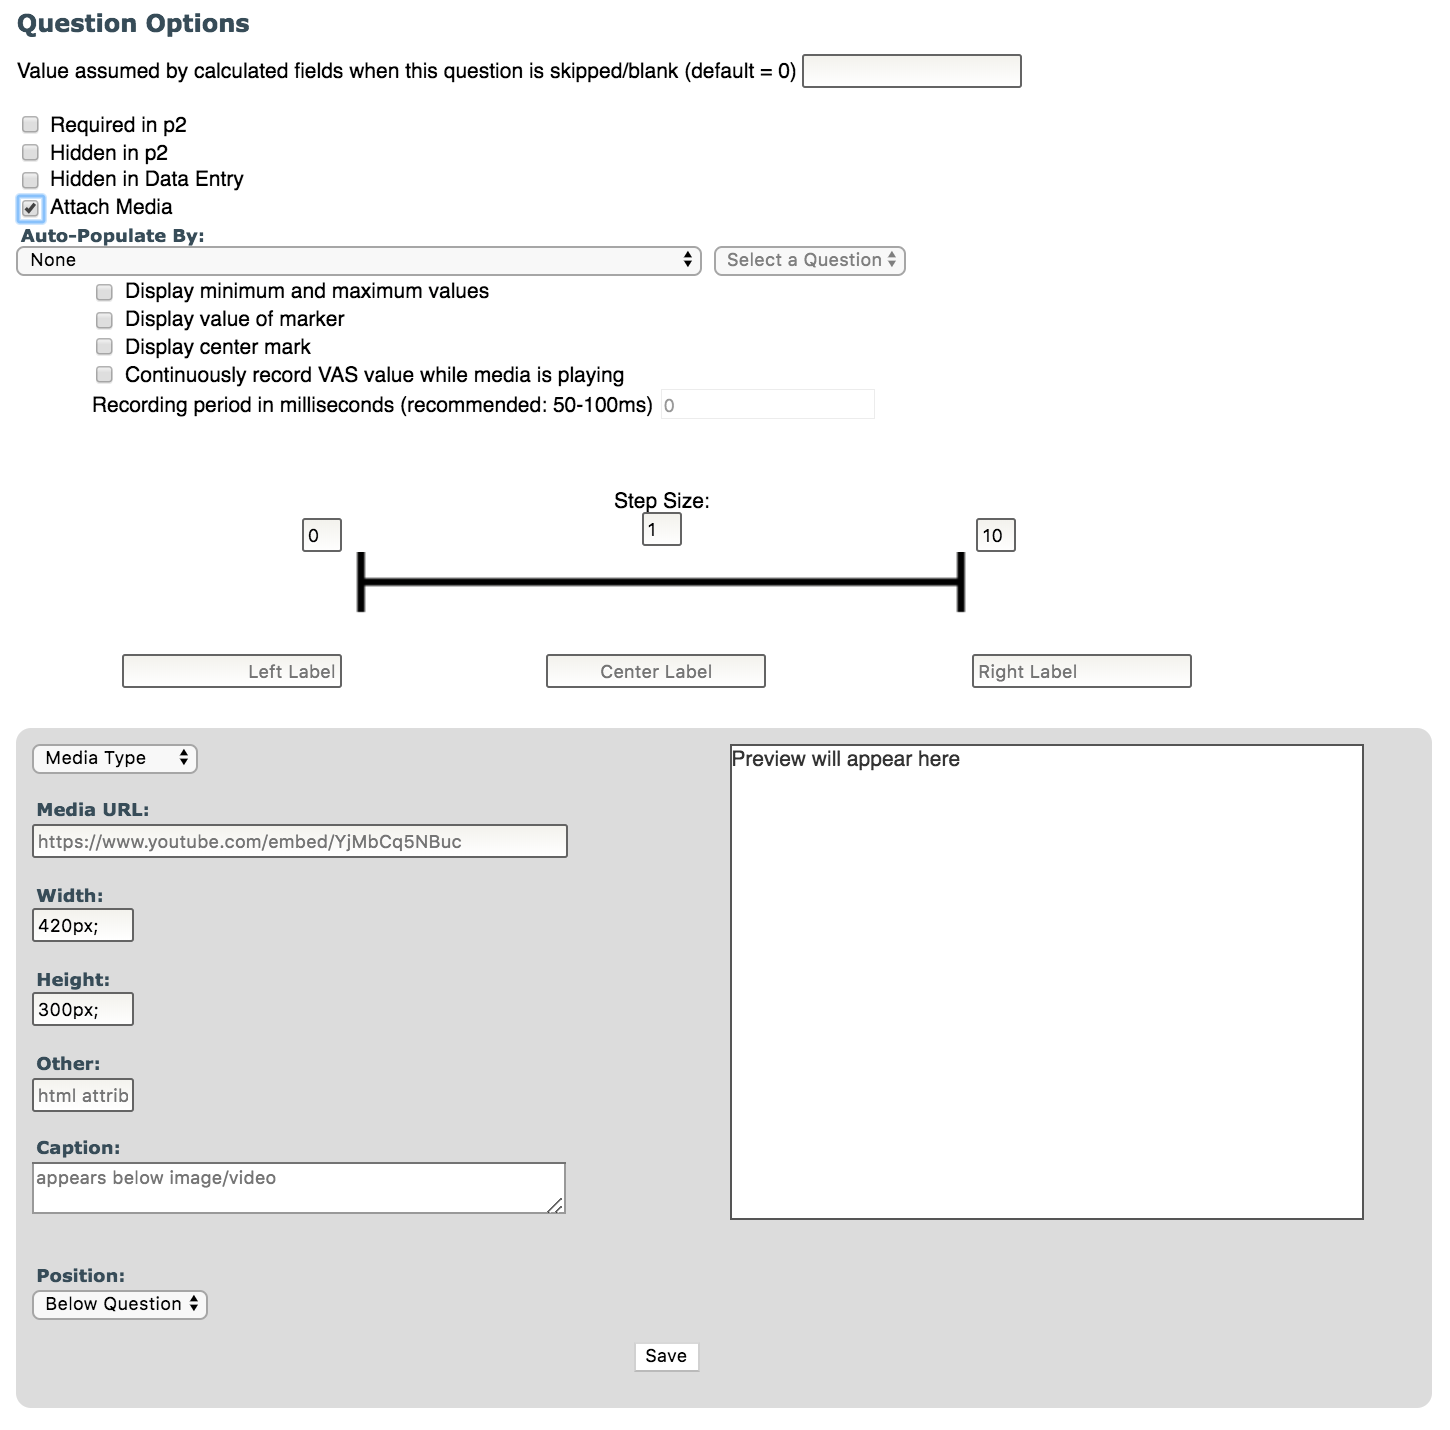
To attach media to a new question, first add the question to the instrument and save it. Then click the pencil icon next to the question to edit and choose Attach Media from the question options to make the media attachment box appear.
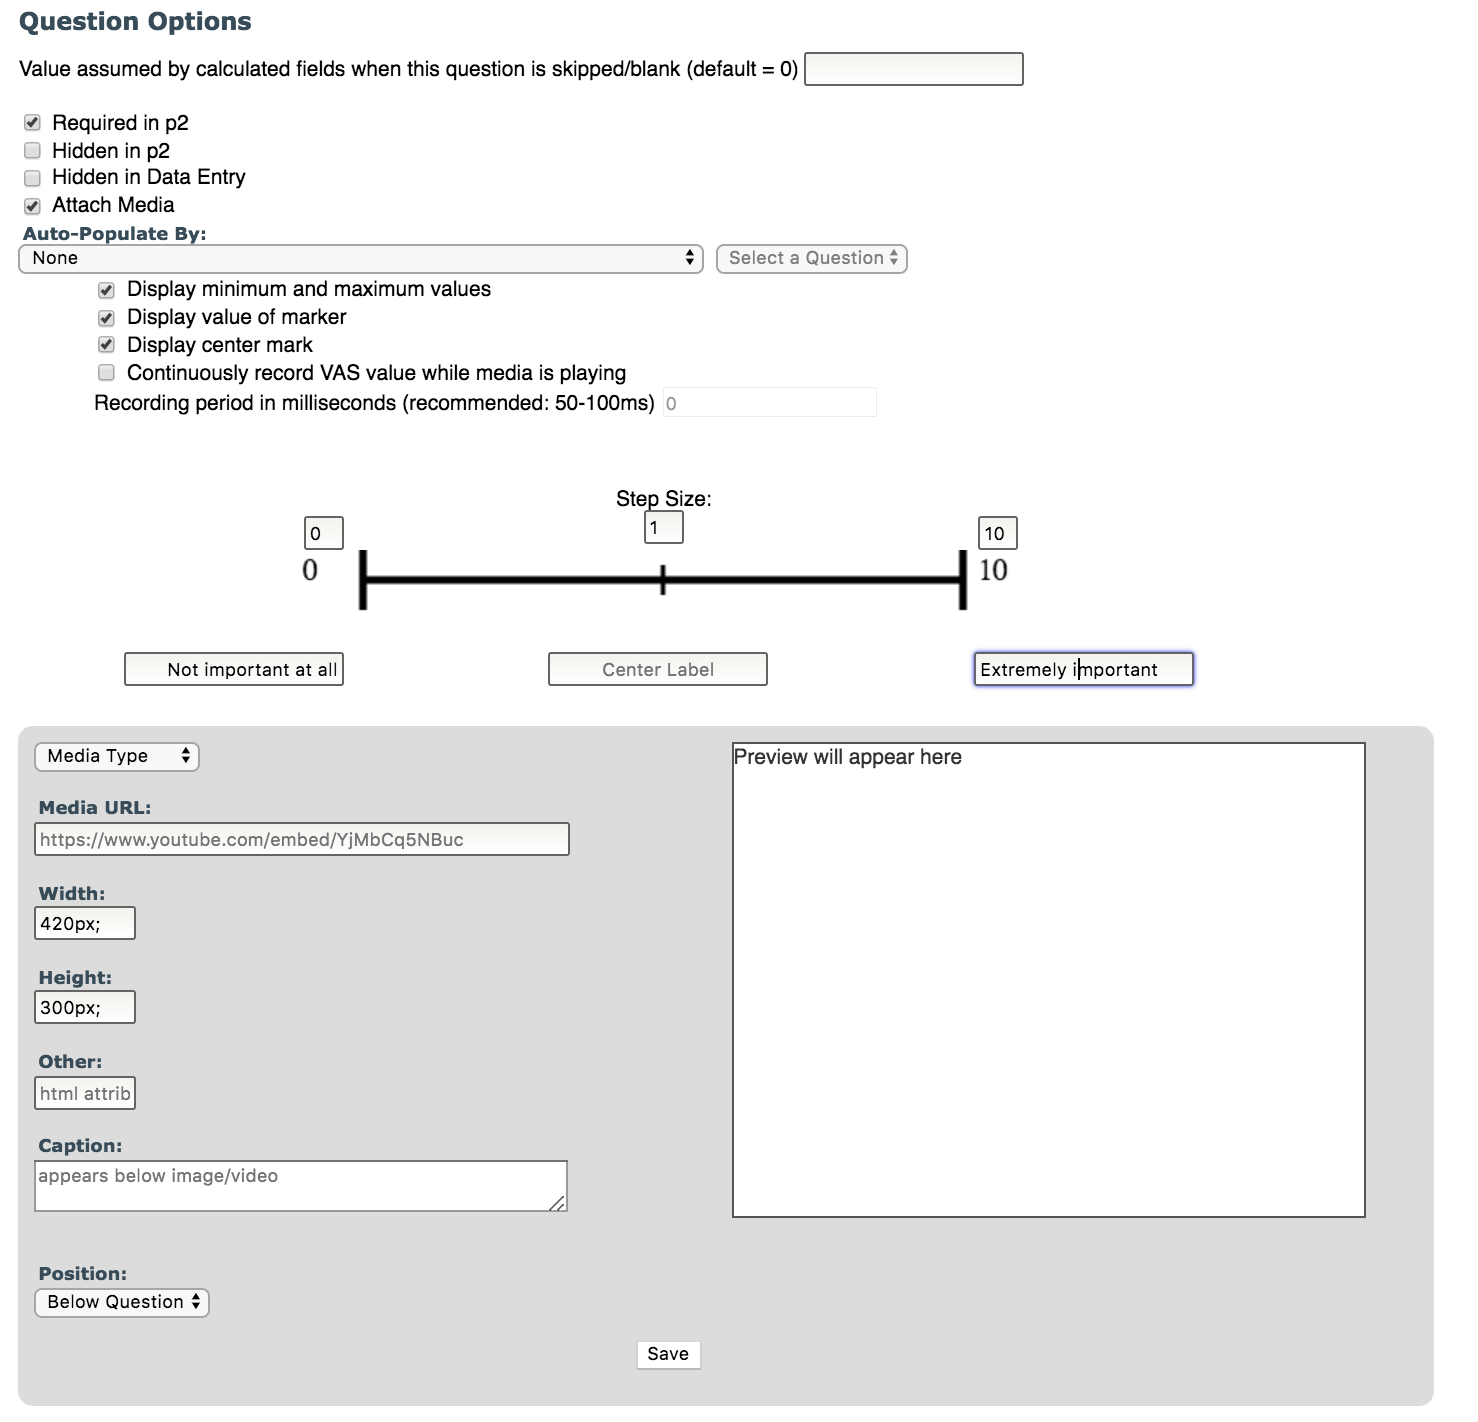
Select which type of media you would like to display (YouTube video or Picture) and then paste in the Media URL.
- The default size is entered but you can edit the size with the Width and Height. For Pictures, you can set the Width OR the Height, and the other dimension will automatically be adjusted to maintain the original aspect ratio.
- There is a field that allows you to enter in an html attribute, for example, ‘+filter:grayscale(1)’ will make the video black and white. For other html options, go to w3schools.
- You can insert a caption for the media in the Caption box which will be displayed below the media.
- Select Above Question or Below Question from the Position drop box to determine where media will be displayed.
Click Save and you will see a preview on the right. Click Update to add the media. Clicking Update will automatically save the media information but the question cannot be updated until all information is completely entered.
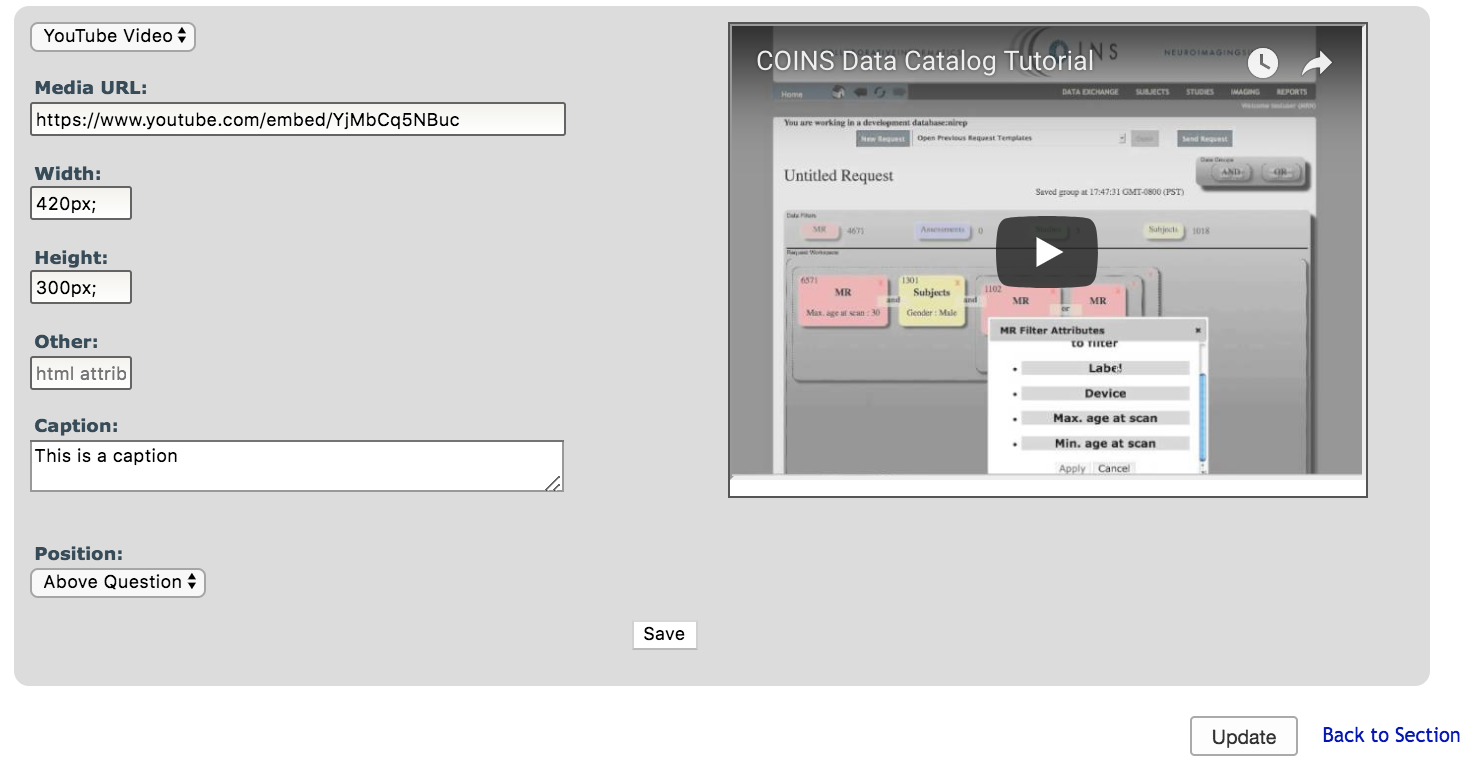
After selecting the responses, click Update. Use SA Preview (click the small magnifying glass after hovering over the pencil/edit icon) to see how your media attachment will look to your subjects.
Continuous VAS Response Option
The VAS can be configured to take measurements at regular intervals while the video is playing. This can be used to allow subjects to rate their emotional response to images/sounds in a video over time.
- To record VAS responses this way, check the box next to Continuously record VAS value while media is playing.
- You can choose the frequency at which the responses are recorded in the Recording period box.
- This tool has been optimized to collect data at 50 millisecond intervals. Recording Periods that are greater than 50 milliseconds lead to a 'jerky' experience for the subject. To combat this, the system was also tuned to provide a smooth experience for Recording Periods above 150ms. For an optimal user experience, we recommend choosing a Recording Period of either 50 or 200+.

Continuous VAS Recording Interval Variation
The recording period is not set in stone and should be thought of as how often you want the system to try to record responses, barring any other activity in the browser that would disrupt it. This is a side effect of how instructions are processed by the browser, and is not specific to COINS.
Under normal circumstances, the actual mean interval between recordings can be expected to be within 2% of the specified Recording Period, with a standard deviation less than 15% of the specified Recording Period. However, some recordings may be delayed as much as 200ms.
We recommend asking your subjects to close any other tabs and windows while completing assessments with Continuous VAS questions. This will increase the precision and accuracy of the actual recording period by reducing the number of parallel processes that are competing for CPU-time on the subject's computer.
Video VAS in Self Assessment
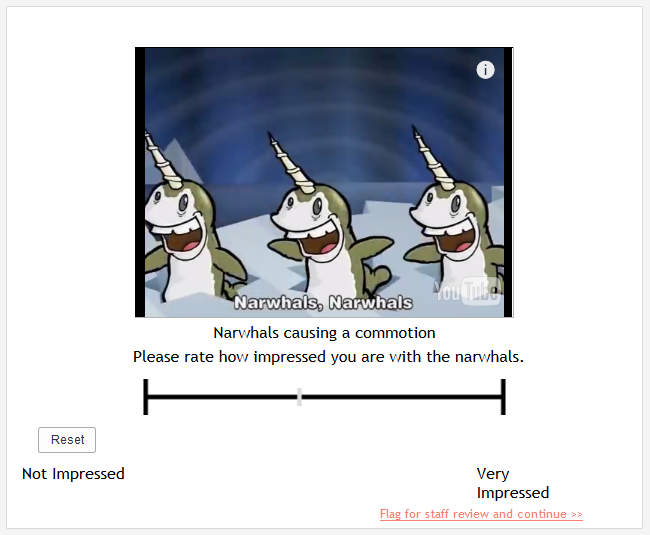
In Self Assessment, the subject must first click Play on the VAS in order for the video to begin. A pop up will appear with brief instructions for the VAS, once they click OK the video will begin.
Before video starts:
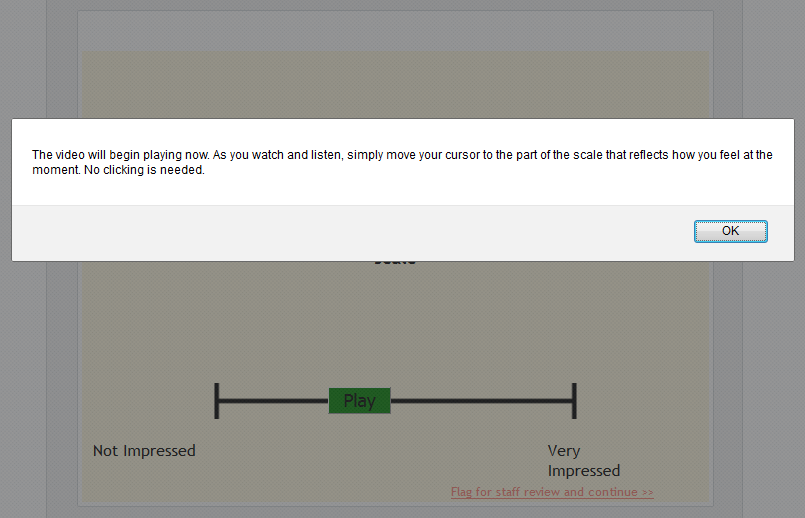
Video Playing:
Continuous VAS Response Output
The measurements for VAS continuous responses will be recorded in a delimited string of the form:
time1,status1,value1
time2,status2,value2
Where time is the time elapsed from when the subject clicked 'play' in milliseconds. Status signifies the state of the video player: NOT_STARTED, ENDED, PLAYING, PAUSED, BUFFERING and LEFT_WINDOW. The value is the value of the VAS.
Note: if the subject clicks on a different window or tab, that event is recorded, and the video is paused until they come back. LEFT WINDOW is displayed if the user went to a different tab/window during the video.
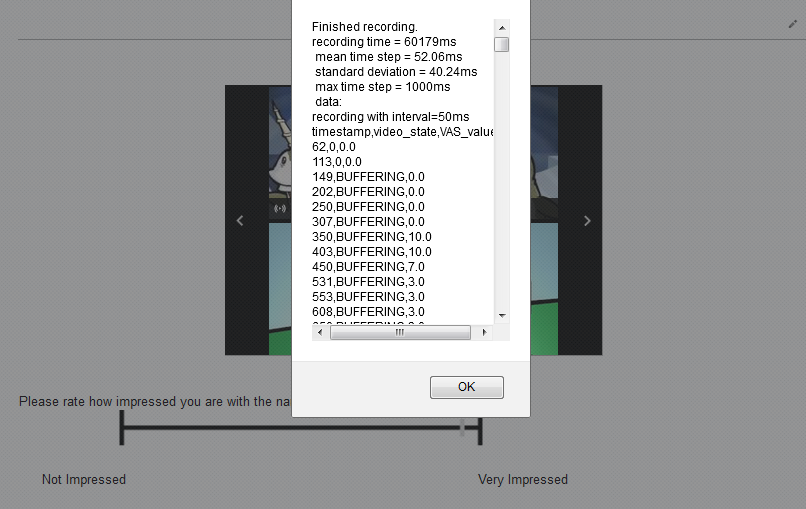
When previewing and editing the instrument, you may also experiment with the VAS-Video tool. In this case, following the end of the video, a pop-up will provide you with data collection statistics and the first several-thousand lines of data that was collected. You will see this pop up contains the statistics of the measurements: mean recording period, standard deviation and max recording period.
The standard deviation and max-recording-period measured while in preview mode will be about twice as high as actual values in Self Assessment.
Comments