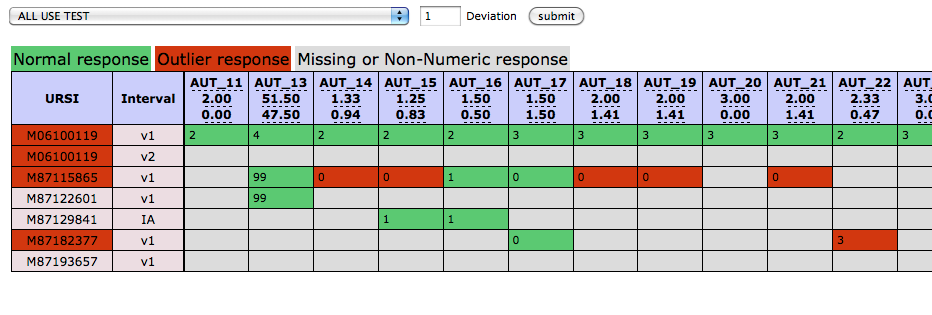
Go to Outlier Report from the Reports menu, select the instrument of interest, fill in the standard deviation and click Submit.
Only the questions with numeric responses were pulled for this report, so you will not see questions on the report that have non-numeric responses. Also, DSM, multiple choice, and media upload question types have been explicitly excluded. A red URSI cell (first column) means that there is at least one outlier for that URSI in the instrument.
The number of deviations to calculate the outlier. If abs(response_value - mean)/deviation > 3, then this response_value is an outlier. Here mean and deviation are the values under the question ids in the first row for each question. 3 is the number which user inputs in the box, if different number is given, the displayed result will be different.
The standard deviation is based on the average response to each question for all subjects that have data for that assessment.
Comments